| Name | curve() |
||||||||||||||||||||||||
|---|---|---|---|---|---|---|---|---|---|---|---|---|---|---|---|---|---|---|---|---|---|---|---|---|---|
| Examples |

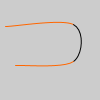
noFill() stroke(255, 102, 0) curve(5, 26, 5, 26, 73, 24, 73, 61) stroke(0) curve(5, 26, 73, 24, 73, 61, 15, 65) stroke(255, 102, 0) curve(73, 24, 73, 61, 15, 65, 15, 65) | ||||||||||||||||||||||||
| Description | Draws a curved line on the screen. The first and second parameters specify the beginning control point and the last two parameters specify the ending control point. The middle parameters specify the start and stop of the curve. Longer curves can be created by putting a series of curve() functions together or using curveVertex(). An additional function called curveTightness() provides control for the visual quality of the curve. The curve() function is an implementation of Catmull-Rom splines. Using the 3D version requires rendering with P3D (see the Environment reference for more information). | ||||||||||||||||||||||||
| Syntax | curve(x1, y1, x2, y2, x3, y3, x4, y4) curve(x1, y1, z1, x2, y2, z2, x3, y3, z3, x4, y4, z4) | ||||||||||||||||||||||||
| Parameters |
| ||||||||||||||||||||||||
| Related |
curveVertex() curveTightness() bezier() |
Updated on Tue Feb 27 14:07:12 2024.
If you see any errors or have comments, please let us know.

This work is licensed under a Creative Commons Attribution-NonCommercial-ShareAlike 4.0 International License